
Recently, we published our analysis of the San Francisco Natural Areas Program (NAP)’s use of pesticide, and compared it with the rest of SF Recreation and Parks Department (SFRPD) . We said that NAP’s pesticide use had risen in 2013, and it had used more herbicide than the the rest of SFRPD put together (excluding Harding Park Golf Course).
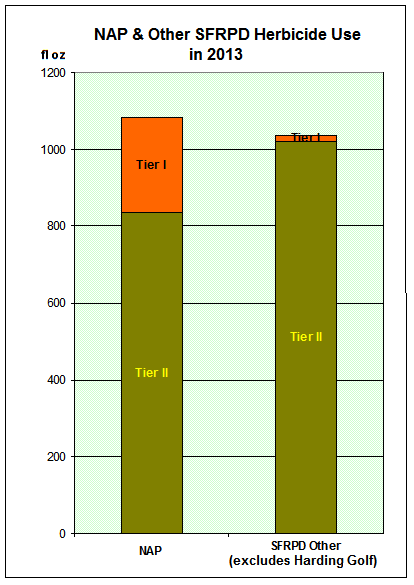
That’s not quite true. They actually used only 84% as much by volume, and 78% as much by Active Ingredient, with one-quarter of the total area.
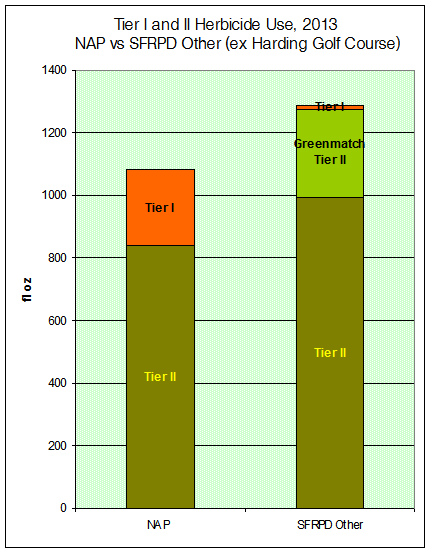
Here’s the corrected graph. This one is by volume of herbicide used.
Here’s the graph we showed earlier:
 What’s the difference? In a word, Greenmatch.
WHAT’S GREENMATCH?
Greenmatch is a herbicide based on lemongrass oil, or what is called a “botanical.” It’s actually considered acceptable for organic gardening. We’d known SF Department of the Environment (SF DoE) had rated it Tier III, least hazardous. We’d therefore omitted it from our calculations since we’re concerned with Tier I and Tier II (more hazardous and most hazardous) herbicides.
We hadn’t realized that in 2013, SF DoE had downgraded Greenmatch to Tier II. Thus, to be consistent, we needed to include it. The SFRPD used quite a lot of it – around 280 fl oz, because it is a good option compared to some of the synthetic herbicides. NAP didn’t use any Greenmatch in 2013.
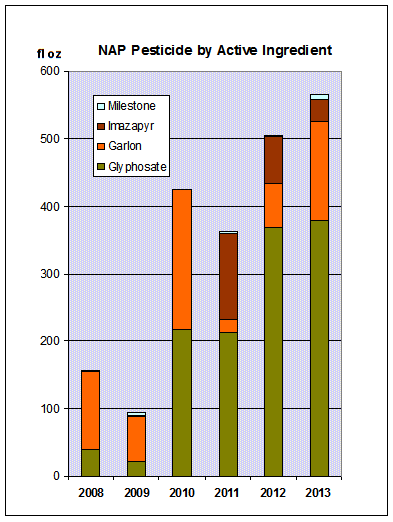
ACTIVE INGREDIENT
Our earlier calculation also looked at simple volumes. We do this calculation because some of the “inert” substances that make up maybe half of the products applied are not necessarily innocuous, and so the total volume matters.
However, we also looked at the “active ingredient” – the amount of actual pesticide. Here’s that graph.
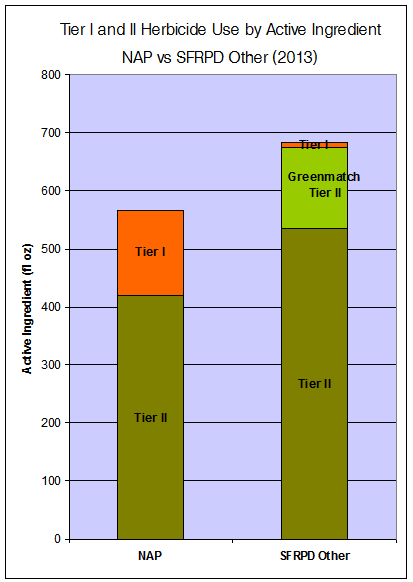 Again, it’s Greenmatch that makes the difference.
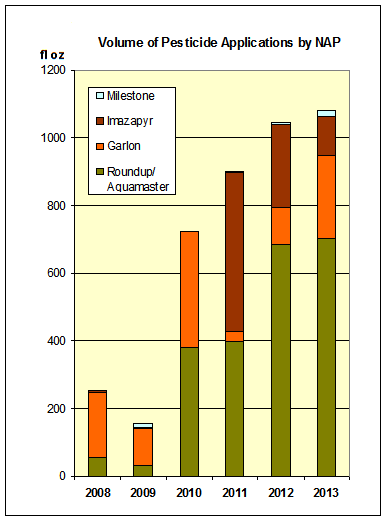
NAP USES MORE TIER I HERBICIDES
NAP was by far the largest user of Tier I herbicide -mainly Garlon 4 Ultra. (Other SFRPD used a small amount of Garlon, and one application of Cleary’s fungicide in the Golden Gate nursery, inside a greenhouse.)
Since NAP does not use Greenmatch, we haven’t changed our other assessment – that NAP’s overall herbicide use rose again in 2013. This graph shows volume of herbicide applied.
 This one shows amounts by Active Ingredient.
 OUR METHODOLOGY
For those who want to dig into how we got our numbers:
1. Under the Sunshine Act, we obtained the ‘usage reports’ – the monthly reports submitted by each department. This lists how much of each pesticide they used, where, for what purpose, how applied, under what conditions and by whom. NAP usually submits two, separately for pesticides it applies, and the pesticides used by their contractor Shelterbelt. These are what we used for 2011-2013. (For 2010, for NAP we had a mix of monthly reports and compiled data supplied by SF DoE, and for 2009 and 2008, it was compiled data from SF DoE.)
2. If any data were illegible, we requested -and got – clarifications. We entered these data into a spreadsheet. In 2013 we kept a record not only of NAP pesticide use, but also other SFRPD Departments’ herbicide use.
3. We calculated total herbicide use, by product, for NAP and SFRPD Other.
4. We excluded Harding Golf Course. It used a substantial amount of pesticides because it’s required to maintain the course in tournament-ready condition. There’s a contract that’s really outside SFRPD’s control, and so would distort the picture. But we do include the other city-owned golf courses -which are under SFRPD control and actually use little Tier II or Tier I pesticide.
5. We calculate four measures of usage for NAP:
- Number of applications. This measures the number of opportunities for exposure.
- Volume of applications. This takes into account that the other ingredients in a pesticide formulation could be chemically active, though not pesticides themselves.
- Volume by active ingredient. This is the most common measure and the one SF DoE prefers to use; and
- Volume by acid equivalent. This is largely significant when two or more products with the same active ingredient are being used.
To get the last two measures, we use a factor derived from the Materials Safety Data Sheets for each product.
6. To compare SFRPD Other (excluding Harding) we looked at volume, as well as active ingredient. Those are the graphs shown above. (We couldn’t do an acid equivalent because it doesn’t apply to lemongrass oil in Greenmatch EX.)
We try to be rigorous in our analysis, and offer reproducible results. If we discover errors, we will acknowledge and correct them here.


Pingback: Sutro Forest in January 2014 | Save Mount Sutro Forest